
|
What is it about New York City? The inconvenient conveniences? The relentless and resilient energy? The West Village? The historic Yankee pinstripes? Regardless of your chosen NYC fascination... this city is the center of the world, and arguably the world's most important. Thousands of people, industries, ideas, leaders, and ways of thinking amalgamate into an irreplaceable conglomerate... the Big Apple. Imagining this city any other way is an arduous task. In fact, how did this place look before ambitious people from anywhere and everywhere, made it their playground? In a TED talk, Eric Sanderson had the same question. With an 18th century map, Geographic Information System (GIS) software, and sufficient data, he converted the Metropolis to Henry Hudson's first 1609 view. During his research, he found a map of Manhattan circa Revolutionary War, and was interested in the ecological findings. Discovering marshes, streams, and beaches, he wanted to orientate himself and plot exactly where they would exist in modern day Manhattan. He calculated slopes, examined elevation, and measured wind patterns. Equipped with the technology to map bedrock geology, soil formations, and water bodies, he discovered 55 different ecosystems supporting extraordinary biodiversity. This is greater per acre than Yosemite and Yellowstone parks. Turns out-Time Square was once a wetland, Gramercy Park was a swamp, and Native Americans and black bears were prevalent. Taking any view (window, rooftop, etc...), Sanderson can replicate (using GIS) exactly what species, fauna, animal, or tribe existed in that specific area. It is hard to imagine Manhattan as a biodiversity hotspot. Well... I guess... technically it is. The interconnectedness and resilience that made it unique back then, is the same interconnectedness and resilience that makes it the greatest city today. Combining science, technology, and visualization, GIS can be an impetus for innovation. Click here to watch this TED talk. Be Authentic - Sterling 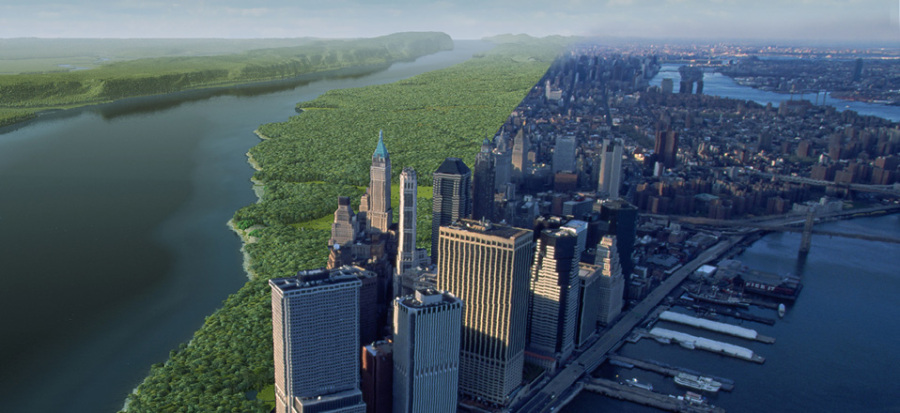
1 Comment
Google is being Google again... are we surprised? To date, their unrivaled innovation includes: driverless transportation, artificial intelligence experiments, and floating data centers. For those unaware, a data center is a facility used to house computer systems, various components, back-up power supplies, environmental controls, and security devices. Due to the exponential boom of data, these centers account for approximately 2% of total domestic energy usage. This increased energy usage means higher costs and greater emissions. A push to green-up data centers has caught fire, and biomimicry always seems to be the answer.
|

Sterling FaubelDallas, TX Archives
January 2017
Categories |
 RSS Feed
